
When it comes to Business intelligence technologies, Power BI and Tableau takes the lead offering smooth collection and integration, along with systematic analysis and engaging presentation of data related to your business infrastructure.
These BI tools can help you execute different data based complex table calculations like data visualization, data manipulation, data modeling, and data analysis for converting your business data into meaningful and actionable insights.
Most data analysts and researchers are often stuck in a dilemma of deciding which of these tools should be integrated and used to boost their business. Read more to know about major key differences and similarities for Tableau vs Power BI to solve your business-related challenges.
Power BI VS Tableau
Before getting any deeper into Power BI vs Tableau bi tool comparison, let's figure out the background of both these tools.
Tableau is known as a reliable bi tool with extensive database connectivity capabilities for managing consistent data flow that convert your seemingly ineffectual data into useful information. It offers visually attractive data visualizations for presenting your data and showcasing insights.
In comparison Power BI is a powerful data visualization tool directed by Microsoft to provide business analytics solutions. With Power BI you get advanced speed and reporting capabilities for analyzing data, extracting details, and sharing it across different departments within your company.
For more details about Power BI, read How to Make Data-Driven Decisions Using Power BI Consulting Services
Power BI vs Tableau - Key Characteristics
Any data visualization tool is all about features that it can provide for the users to simplify their workload. Following are some of the key elements that can simplify the debate of Power BI vs Tableau for you!
Performance of Power BI and Tableau
Power BI: Most data analysts consider Power BI as an easy-to-use platform because of its speed and performance when you have a restricted data volume.
To execute complex data analysis expressions or natural language query, it is important to have a fast-paced business intelligence tool, but Power BI lacks in handling bulk data.
Tableau: Tableau is able to process enormous amounts of data quickly. It is quicker and offers a wide range of tools for data visualization.
Tableau gives you a 360-degree perspective of your data helpful for data analytics by not imposing row or size restrictions, restricting the number of data points in visualization, etc.
Data Visualization in Power BI and Tableau
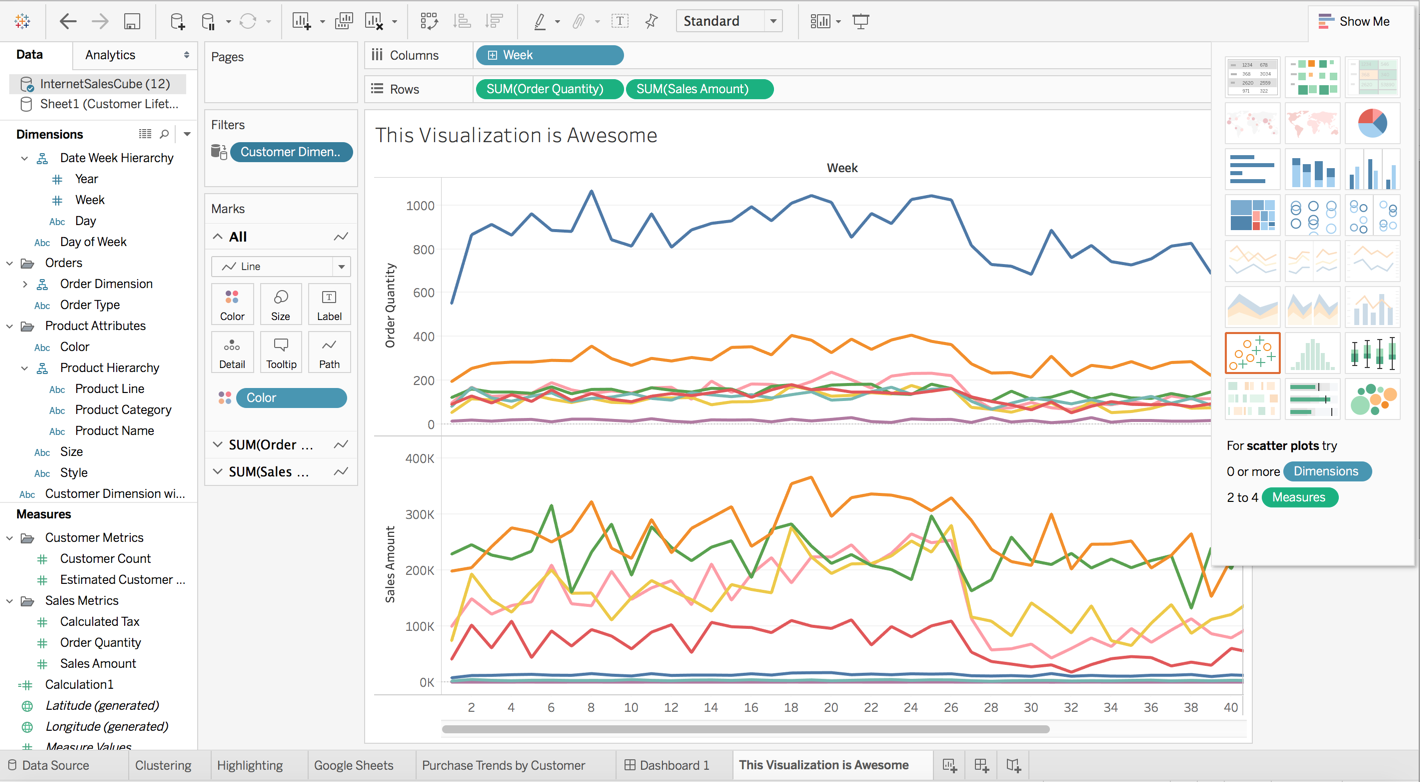
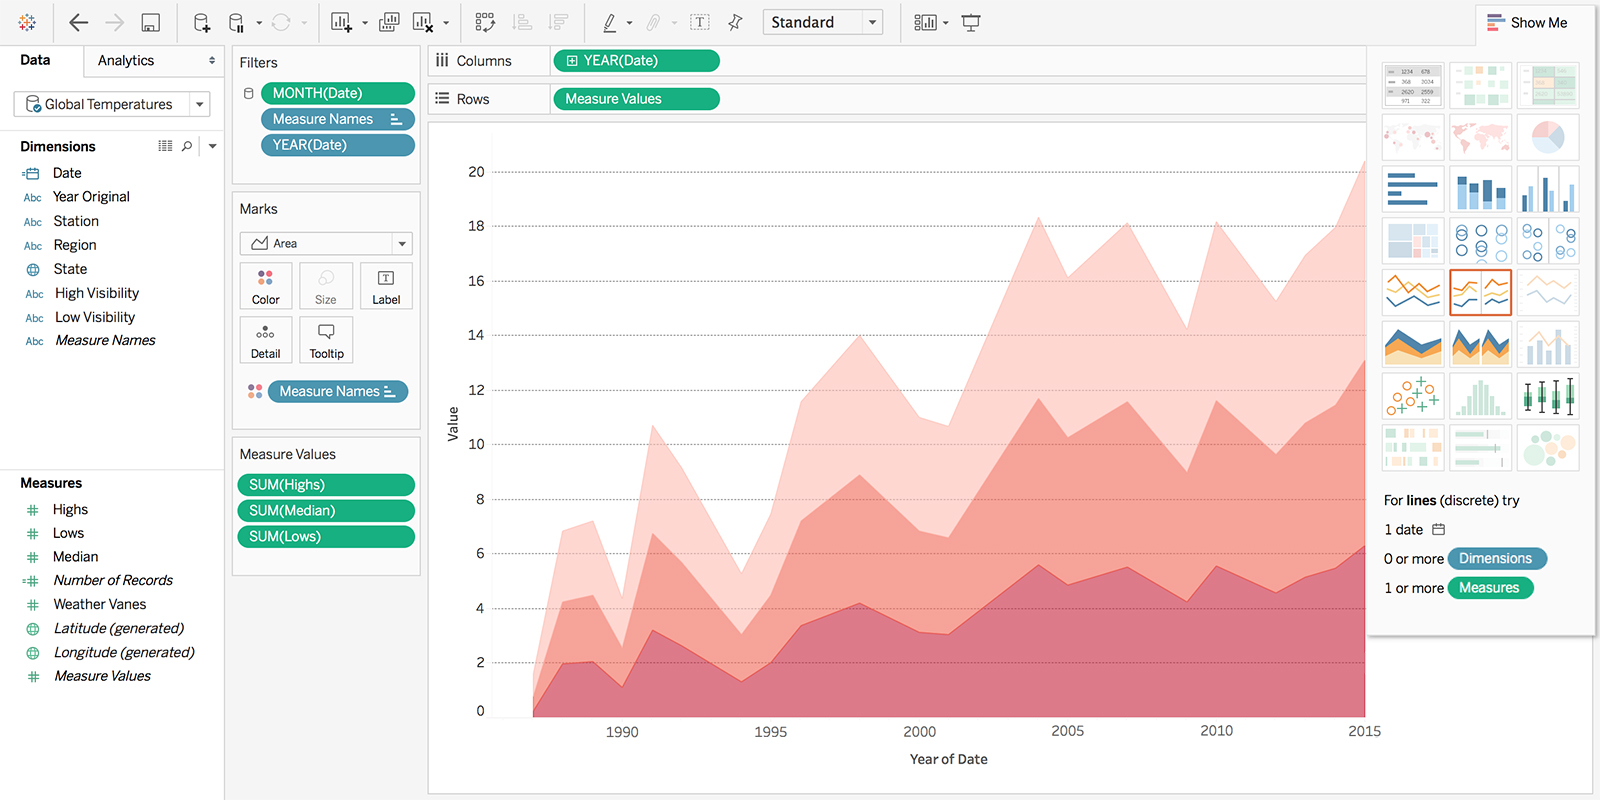
Tableau: When it comes data visualization, Tableau server users can modify dashboards to fit a particular device. Tableau desktop provides dynamic, interactive images that enhance insights.
It can convert your search terms to visualize data and encourages you to look for patterns and opportunities. As Tableau online includes built-in table computations to produce reports and dashboards, you don't need any prior experience to use it.
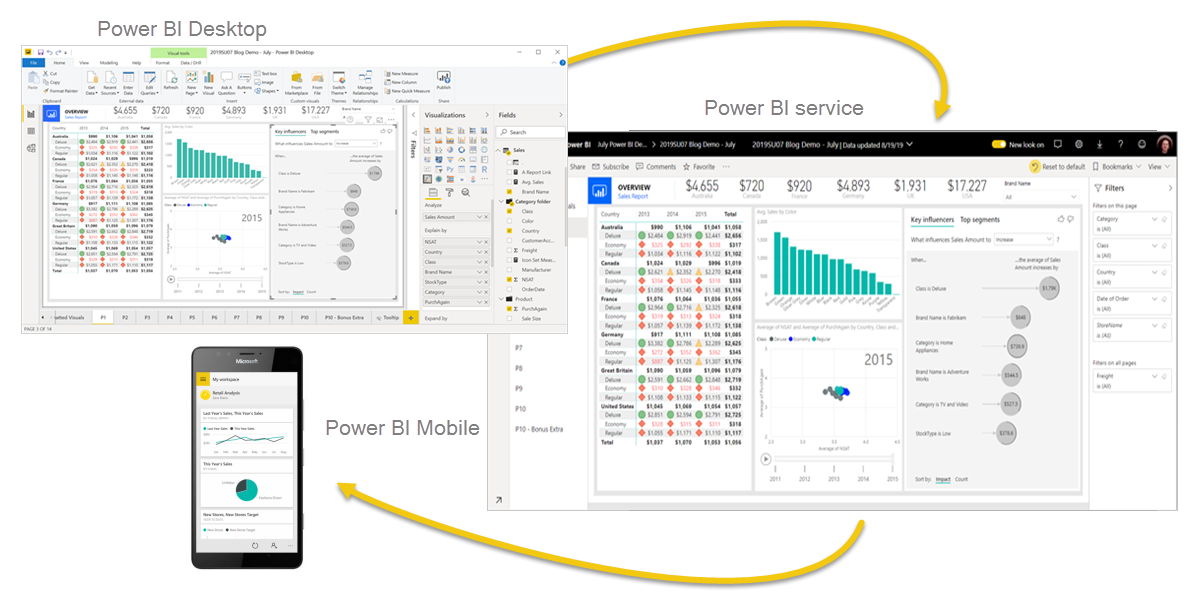
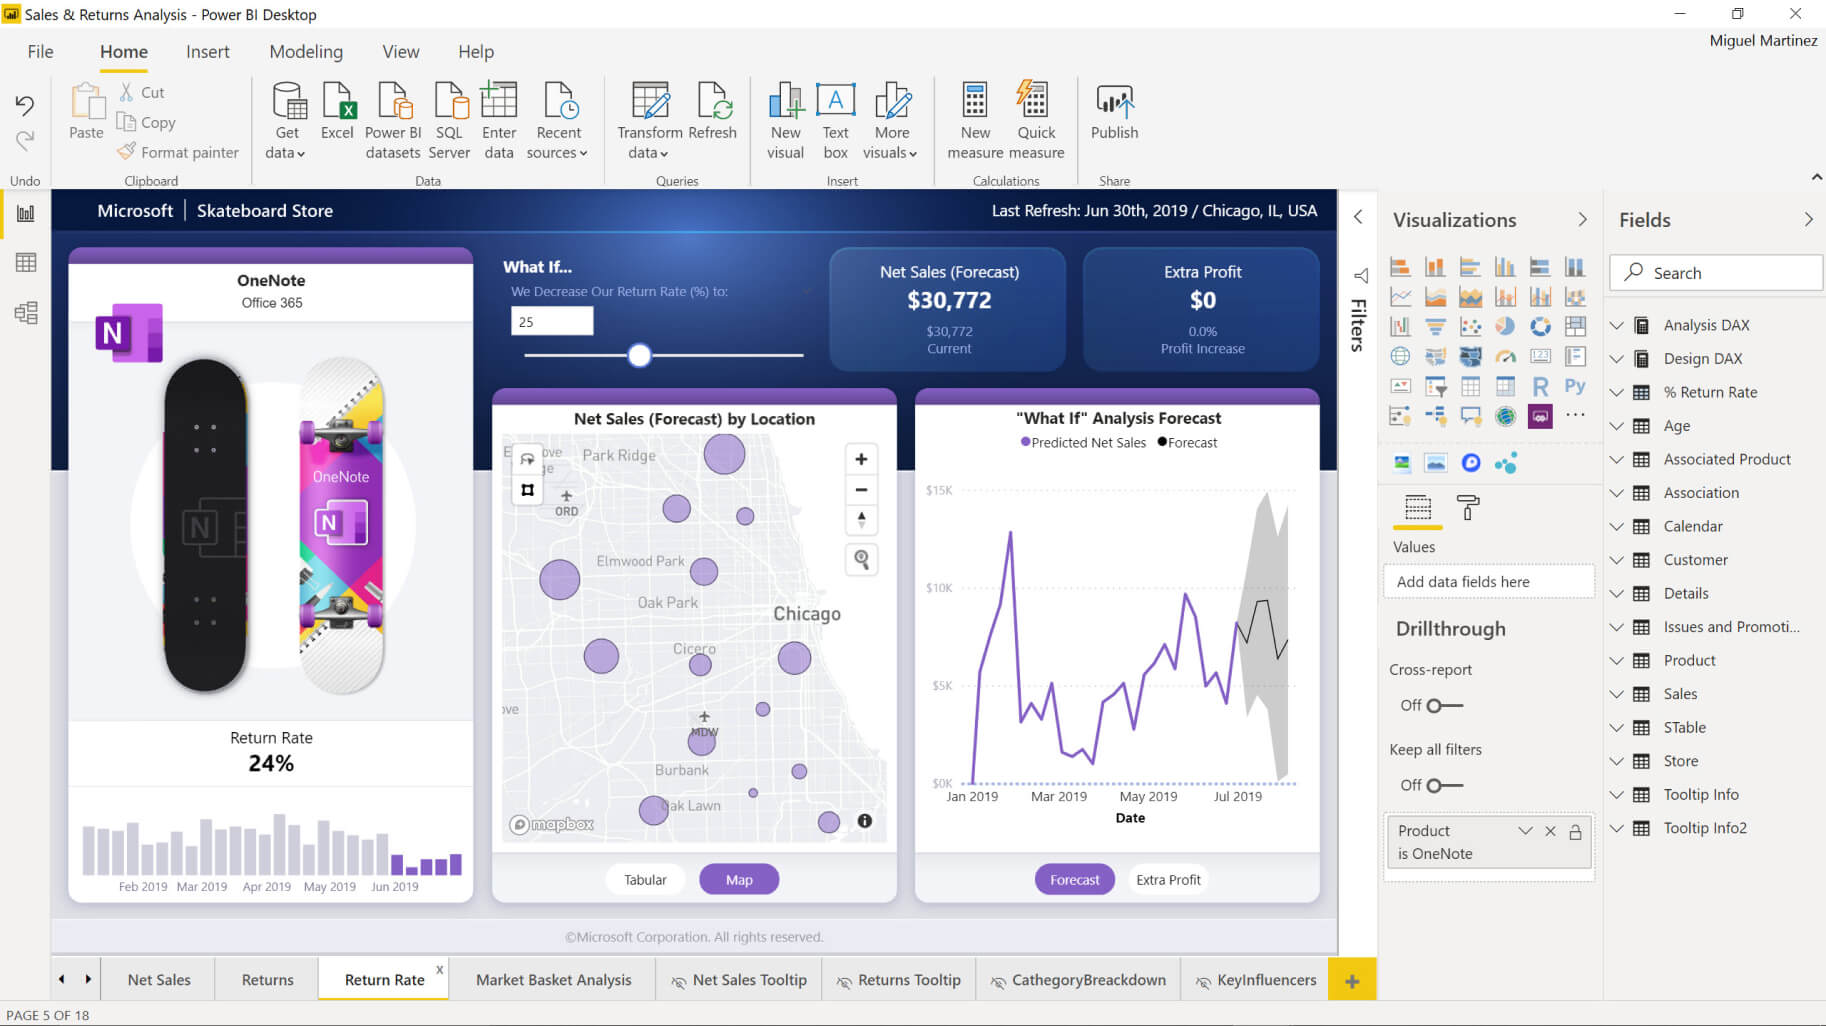
Power BI: While Microsoft provides an easy to use drag and drop functionality for Power BI dashboard. It provides features that make data visually appealing and also offering a wide variety of detailed and attractive visualizations for creating reports and dashboards.
Power BI service lets you ask all your data-related questions, offering meaningful insights in return.
Programming Support for Power BI and Tableau
Power BI: For data modelling and manipulation, Power BI supports Data Analysis Expression and M language. Microsoft Revolution Analytics can also integrate to the R programming language, although this feature is only accessible to enterprise-level customers.
Tableau: Tableau's R language integration is far superior to Power BI's. Any of the four programming languages, C, C++, Java, and Python, can be used to create the Tableau Software Development Kit.
Connecting to these programming languages will enable you to create data visualization that are even more potent.
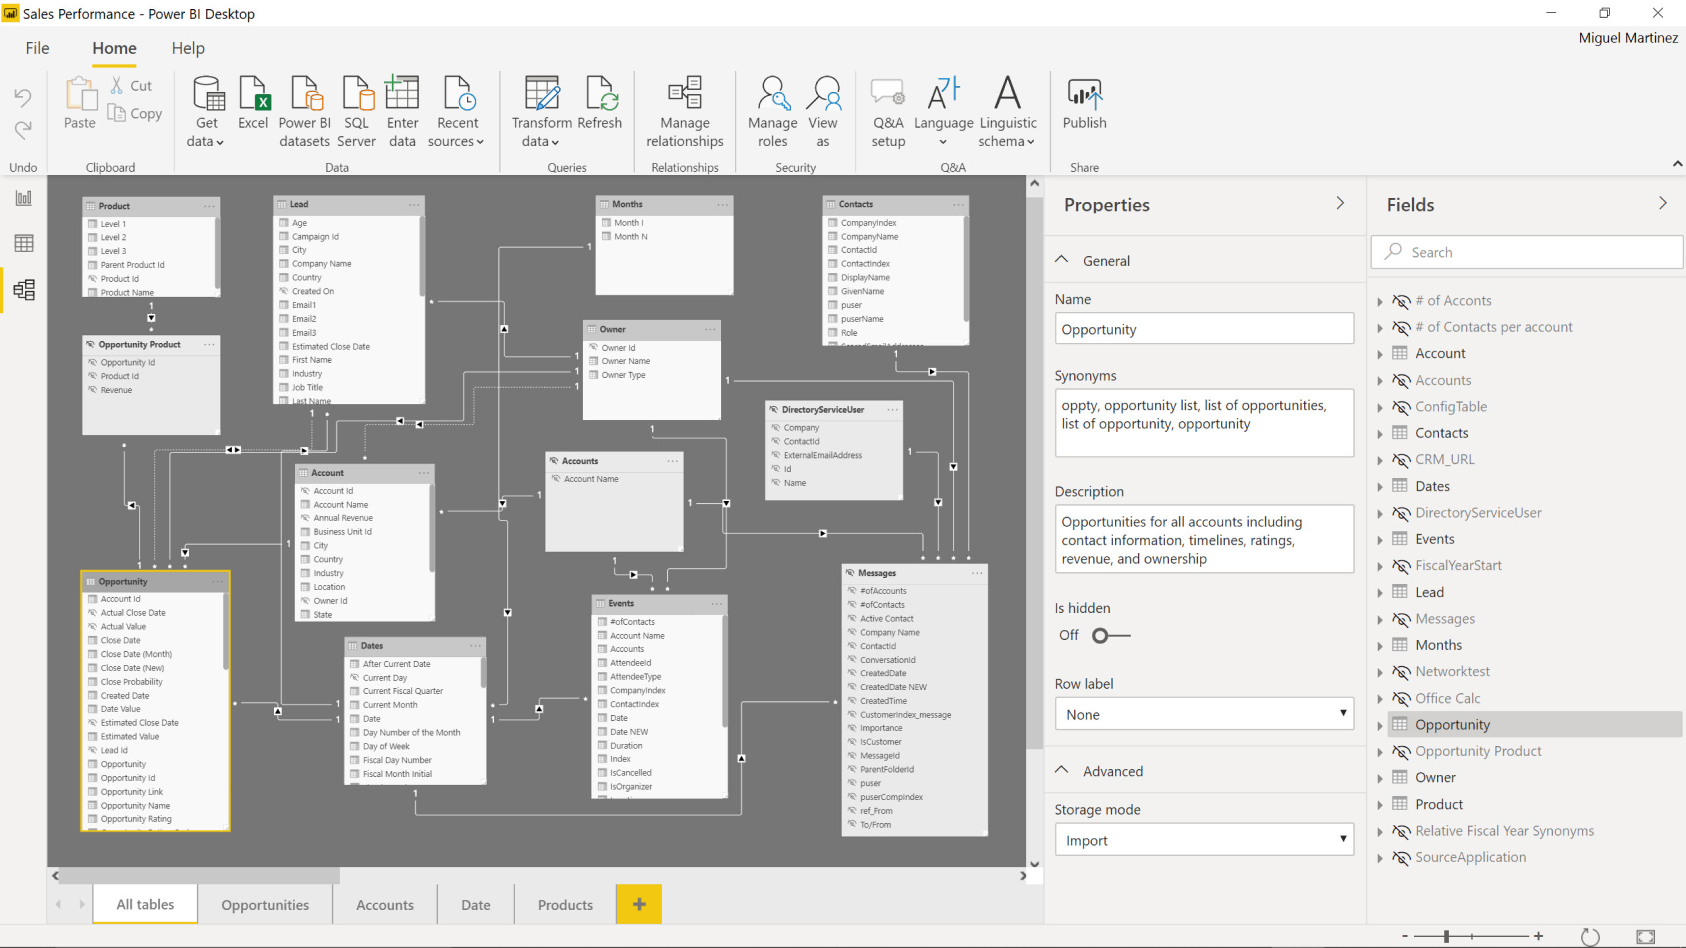
User Interface of Power BI and Tableau
Power BI: Power Bi offers intuitive user interface which can be integrated with other Microsoft products quite efficiently, making it easy to understand. It is simple to use and enhances your productivity.
The Power BI reports, the data view, and the model view are the three views offered by Power BI Desktop that you can choose from on the left side of the canvas.
Tableau: In comparison, you can design and alter dashboards using Tableau's intuitive user interface in accordance with your needs. It features a warm workspace that invites you to play with data and produce insightful insights.
Different cards and shelves, a toolbar, a sidebar, a data source page, a status bar, and sheet tabs are all present in the workspace.
Ease of Use
Power BI: Power BI has an edge because of its ease of use since it is based on a user interface that has its roots in Microsoft Office 365, which most end-users are already familiar with.
Tableau: Tableau provides some essential advantages for exploring and visualizing data in detail. Tableau is also incorporating natural language capabilities into its software. This helps in finding solutions to complex problems by understanding the data better.
Customer Support in Power BI and Tableau
Power BI: Due to its relative youth in the market compared to Tableau, Microsoft Power BI report server has a lower user base.
Tableau: Tableau Server has over 150,000 active customers participating in the Tableau online community and over 160,000 active users participating in over 500 global user groups.
Data Sources in Power BI and Tableau
Tableau: Comparing Power BI vs Tableau in terms of data sources, Tableau takes the lead. Being an excellent data analytics tool, it can access multiple data sources and numerous data points.
The data sources include Excel, Text File, PDF, JSON, statistical file, Amazon Redshift, Cloudera Hadoop, Google Analytics, Drop Box, Google Sheets, Google Drive and others.
Power BI: Power BI service supports various data sources but has limited access to other databases and servers compared to Tableau.
Some of the examples are Microsoft Excel, Text/CSV, Folders, MS SQL Server, Access DB, Oracle Database, IBM DB2, MySQL database, PostgreSQL database, etc.
Power BI vs Tableau - Similarities

Both being data visualization tools, Microsoft Power Bi and Tableau has some major similar notes, including:
Popularity
Power BI and Tableau are the top two selling business intelligence products on the market, according to research from Gartner. Power BI significantly outperforms Tableau, which has an average rating of 4.3 stars out of 5 from over 2100 reviews, with an average rating of 4.4 stars from over 2500 reviews.
Producing a Variety of Different Visualizations Techniques
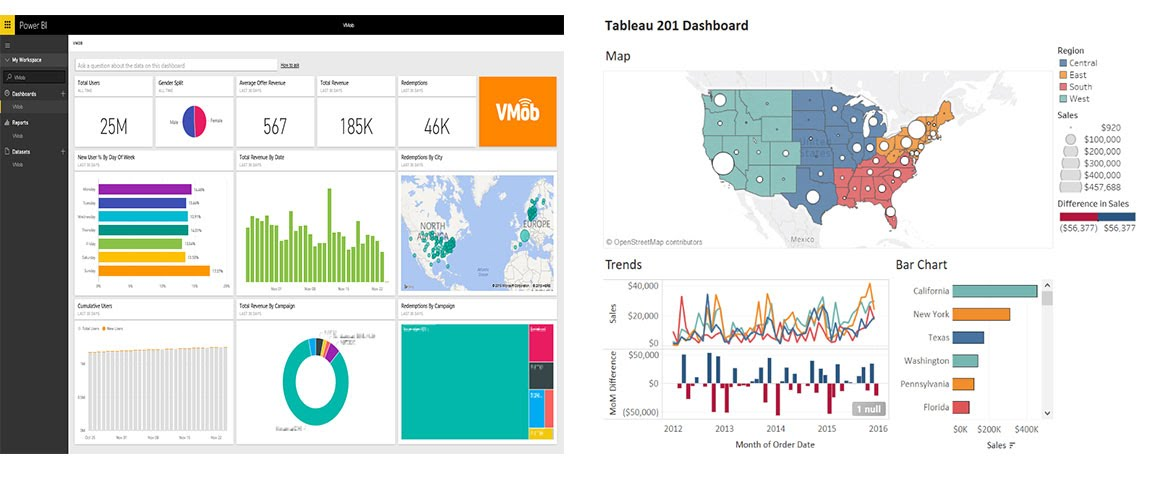
Most data analysts use data Tableau and Power BI, as they offer a variety of ways to show data. There are many visualization options available, such as bar and line charts, tree maps, and geographic maps.
These visualizations may be interacted with on both platforms, and you can aggregate them to create interactive dashboards. For example, you can hover over them to receive more details and apply filters.
Connecting to Multiple Data Sources
Visualizing your data is one thing, but having numerous data sources is crucial. After all, organizations frequently collect data through a variety of ways. Both Tableau and Power BI can connect to different sources, which is evident when comparing the two.
The commercial versions of both platforms allow you access to 50+ additional data connections, including Google Big Query, Amazon Redshift, and Salesforce. They include Microsoft Excel, CSV, and JSON. If the underlying data changes, the visualizations are updated.
Code-Free & User-friendly
Having everything you require at your fingertips is one of the benefits of employing business intelligence solutions. Because of this, learning Tableau and Power BI is a great option if you're new to data analytics.
These are two of the most important data visualization tools a business analyst will require when working with data. Power BI or Tableau are two tools you can use to learn how to analyze data.
Of course, there are other options available to you, as the graph below shows. Other useful tools are SQL, R, and Python, and it is highly beneficial to learn one or more of these languages.
Other similarities
Recent improvements have made Tableau and Power BI more comparable to one another.
For instance, Power BI used to be excellent at data preparation since Power Query has always allowed users to model, clean, and add calculated columns to datasets. Yet, with the introduction of Tableau Prep, Tableau has recently made its own strides.
How Much Do Power BI and Tableau Cost?
For effective comparison of both, Tableau and Power Bi as efficient business intelligence tools, you have to also consider the price as a differentiating factor:
Power BI
Power BI pricing plan is divided into three different categories:
Power BI Desktop
Power BI desktop is a free version giving individual access to Power BI with the feasibility of your desktop. This version is perfect for personal use but not for dedicated businesses.
Power BI Pro
Power BI Pro comes with a $13.70 per month for every user. Although you get Power BI Pro free of cost with Microsoft 365 E5 but if you don't have one then you'll pay the subscription fee and get single license to their self-service analytics.
Power BI Pro enables you to visualize data with real-time Power BI dashboards and reports which can be shared across easily with Power BI interface.
Power BI Premium
If you're in search of Power BI premium for enterprises level, then you have to sign up for $27.50 per month for every user. You'll get their big data analytics tools and simplified data management.
For those businesses who want Power BI premium for their entire organization, you'll get a package of $6,858.10 per month, giving you similar access on broader scale.
Tableau
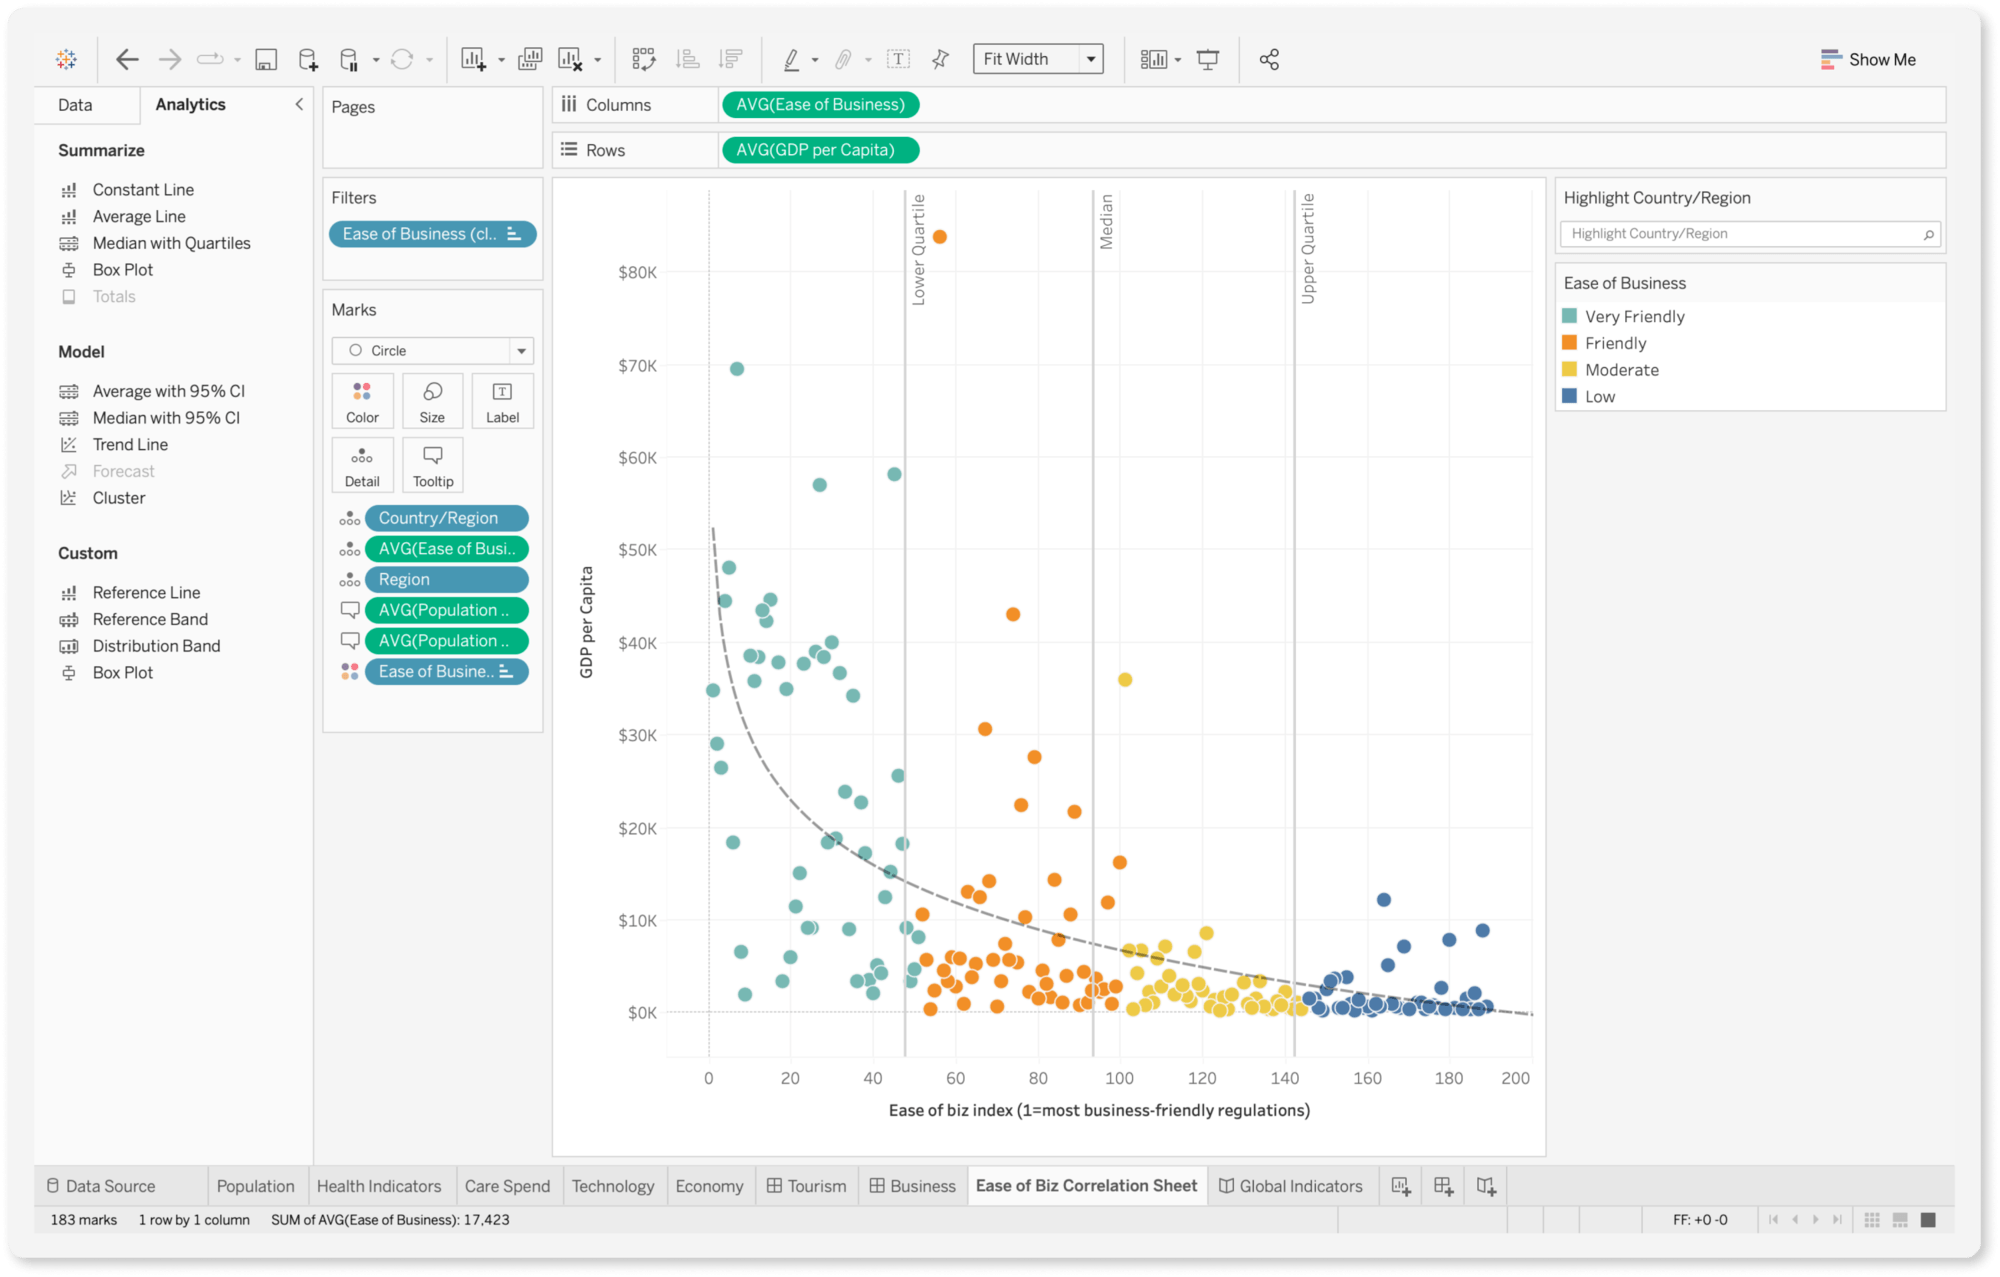
Tableau Public
Tableau Public also known as Tableau Desktop is the free to use platform dedicated to home-based users.
You can create visualizations linked to CSV, Excel, and JSON files using Tableau Desktop that can be viewed publicly.
Tableau Creator
Tableau offers a creator platform for individuals and team members for $70 per month for every user. With Tableau Creator, you get Tableau Prep Builder, Tableau Desktop, and a Creator license for Tableau Server or Tableau Cloud.
Tableau Creator subscription plan is perfect for small teams offering the visualization and analytics tools you need.
Tableau Explorer
Tableau explorer helps you to explore your data using self-serve analytics for $40 per month. You get a Tableau Cloud explorer license with this plan.
Tableau Viewer
The Tableau viewer plan only lets you view your existing Tableau dashboards or visualizations in $15 per month for every user. You'll get a Tableau Cloud view license with this plan.
Power BI vs Tableau - Differences
For making your choice easy and clear, here is a list of differences between Tableau and Power BI to integrate within your business or career more efficiently.
Ease of Use
Tableau: If you'll prominently be using Mac for your work then you can join the list of Tableau users more easily.
Power BI: Power BI is dedicated for Windows users. Considering Microsoft integration, it doesn't work on Mac.
Certifications
Tableau: Tableau provides a greater selection of choices tailored to particular professions. This certification is divided into three levels: associate, specialist, and analyst. There are numerous languages available for the Tableau Associate test.
Power BI: The fact that Power BI offers its exam in a variety of languages, but Tableau only offers its Certified Professional Certification in English, is another significant distinction between the two credentials.
Ease of integration
Power BI: It will be simpler to integrate Power BI into your workstation if you utilize Microsoft Office software because Microsoft designed it.
Tableau: The recent acquisition of Tableau by Salesforce also makes them a viable option because of their native integration.
Yet since both can link to tools like Excel and Salesforce, the real question is which would work better for your setup.
Programming languages
There are other distinctions when utilizing Microsoft Power BI and Tableau with various programming languages:
Power BI: For data modelling and manipulation, Power BI supports the Data Analysis Expression and M language. Microsoft Revolution Analytics is another tool you can use to link the R programming language.
Tableau: With Tableau, you'll have more options and freedom. The Tableau Software Development Kit is also easy to integrate with R and may be used with Python, Java, C, and C++.
What is more popular, Power BI or Tableau?
As per Stintel's detailed research, Tableau has a market position of 12.97% with 31,568 firms using it as of June 2021, while Power BI has a sales volume of 5.43% with 13,201 user companies.
It's worth noting that Power BI was introduced in 2015, 12 years after Tableau, and has quickly grabbed market dominance due to its user-friendliness and Microsoft affiliation. According to an examination of Google search terms, more people are currently searching for Power BI than Tableau.
The final decision, however, is ultimately left to the individual. It varies on your requirements, what you plan to use it for, and what your company needs. Having a know-how of how either Power BI or Tableau is excellent if you're trying to advance your skills and increase your value to future employers.
If you know how to use one of these business intelligence tools, you can easily learn how to use the other. You can start with a Power BI or Tableau introduction and move forward from there.
Frequently Asked Questions
As we have reached the end of our blog, here are some of the most commonly asked questions regarding Tableau vs Power BI products.
Can Power BI connect to Tableau?
Tableau has always been connected with Microsoft Analysis services but now it has taken a step forward with the recent updates, where data models created in Power BI can now be consumed by Tableau.
Organizations employing both tools can gain a significant benefit as Tableau analysts can easily access and analyze Power BI's pre-existing data models.
Which company was founded first?
Tableau was established in 2003 and is recently acquired by Salesforce in 2019. Whereas Power BI has emerged to be a relatively new player in the market, being introduced by Microsoft in 2013. However, Power BI was brought to public use in 2015 after a few years of internal use.
Does Tableau require coding?
Neither Power BI nor Tableau need any type of coding skills. But for those who need some extra insights from data for visualization or analysis, then it never hurts to have a basic knowledge of Python, SQL server, and Python.
How long will it take to learn Tableau or Power BI?
With simply introductory training, you can learn the principles of both technologies in just 3–4 hours. Fluency, on the other hand, can take a lot longer, typically a few months.
How are Power BI and Tableau used?
Tableau users are more likely to discuss about developing data visualizations, according to an analysis of the feedback data. Reporting and data sharing are more frequently mentioned by Power BI users.
This indicates that Power BI users frequently utilize the software to produce reports and distribute them to stakeholders. Although Power BI is more frequently used for reporting and data sharing, Tableau still dominates thanks to its amazing data representations.
Which one is easier - Power BI or Tableau?
Each has a unique set of capabilities and advantages for business intelligence and data visualizations.
Power BI is a better option for beginners because of how user-friendly it is. Power BI is appropriate for small teams with low resources and also offers the capacity to work with various data points.
Large datasets can be handled with Tableau. It is ideal for medium and large organizations and is well renowned for its aesthetically pleasing data displays. A BI Connector can be used by Power BI and Tableau users to connect to Oracle BI & Analytics solutions.


