

As everyday new AI technologies arise, reshaping how average companies and enterprise interacted with data. Nowadays an enterprise generates a large amount of data almost every day and strive to extract meaningful insights from it but, data is nothing on its own. That's where the need of different analytical tools comes in order to find patterns in the collected information, making data a bit more understandable for the users and predict future outcomes.
Microsoft & Artificial Intelligence
Microsoft Power BI application is one of the most renowned analytical tools that has started implementing AI onto Business Intelligence by using different aspects such as machine learning, Natural Language Processing (NLP) and advanced analytics.
The Microsoft team announced in their Power BI article that many new AI features are being developed by Microsoft's existing AI which will benefit all the existing visual features such as Decomposition Tree, Smart Narrative, Q&A and many more.
They also mentioned that they will implement enhancements to their PowerApps including some powerful AI features such as Text analytics, image recognition and integration of Azure Machine Learning. This will help users harness data in order to discover hidden actionable insights which will help them make better well-informed decisions and maximize ROI.
Impact of AI on Business Intelligence
All of these AI-created features will be integrated into existing Power BI licensing and user will not have to cater additional costs. But there is only one limitation in accessing these features as it is only available to users having a Pro license.
For further development they have stated that by 2025, Microsoft Power BI development will become self-sustaining. This development has even made Gartner to rethink its Magic Quadrant completely, as they will now add a new axis called "Ability to Artificially & Intelligently Augment Itself", which will completely transform Magic Quadrant and come up with Magic Cube starting from 2022.
In this article, we will learn about some key AI features of Power BI which you should start using but before that let's look into what's Microsoft Power BI, who uses it and its components.
Microsoft Power BI
Microsoft Power BI is a business intelligence platform which provides tools for analyzing, sharing data and visualizing it to business users even if they are nontechnical. Power BI is a self-service tool which requires a little upfront training in order to use it. Users can download an application called Power BI Desktop and native mobile application known as Power BI app for Windows, Android and iOS devices. There is a special version of the desktop application known as Power BI Desktop for Power BI Report Server which includes Power BI Report Server where companies can maintain their data and reports on premises.
Uses of Power BI
There are various common uses of Power BI which includes connecting different data sets, extracting data from disparate data sources, cleaning the data, transforming and creating graphs or charts to provide visuals of data which can be further shared with other users all in order to find insights within an organization's data.
Power BI can be used in several ways to benefit an organization such as:
story telling through
different types of graphs, charts and data visualizations,
discovering hidden trends and insights
within the data, and
creating different power bi reports displays real time analytics, help
departments forecast future business trends in order to answer questions to maximize company's
profit.
Power BI can also be used to create reports which shows managers or administrators a consolidated view of their organization's data in order to comprehend how departments are performing.
Who can use Power BI?
Even though Power BI is a self-service BI tool which brings data analytics to its users' fingertips, but it's mostly used by data analysts and business intelligence professionals who are responsible for creating data model and reports. Due to Power BI's ease of use people with analytical background are still able to use Power BI and create visualizations.
Power BI can be used by management of a company to oversee a departments or individual employees are progressing, it can also be used by department representatives to aid their respective departments with reports and forecasts.
Additionally, administrators can fully utilize Power BI's exclusive admin portal to configure implementation of Power BI, monitor usage & licenses.
Core Power BI Components
Power BI works by connecting data from multiple data sources and then provides BI dashboards to the user. Users can easily share excel business data, pull data from cloud based or from on-premises data warehouses. Data from cloud-based platforms such as Salesforce CRM is automatically refreshed.
Whereas in some cases Power BI users must setup a refresh schedule or manually refresh when it is connected to Power BI Desktop file or to applications such as Excel workbook to ensure Power BI dashboard or report are updated and are using latest data available.
Power BI consists of a set of applications and can be used on a desktop computer, as a SaaS product, or on a mobile device. Power BI Desktop is an on-premises version, Power BI Service is a cloud-based offering, and Power BI Mobile works on mobile devices.
The purpose of all these different components is meant to let users create & share business insights as they see fit according to their role.
Power BI consists of several components which allows users report sharing and creating, such as:
Power Query:
A data connectivity and preparation tool (advanced version of Power Query in Microsoft Excel).
Power Pivot:
Power Pivot is a memory tabular data modeling tool to perform more complex calculations.
Power View:
Power View is a data visualization tool that allows you to create graphs, charts and other visualizations.
Power Map:
Power Map is a 3D geospatial data visualization tool.
Power Q&A:
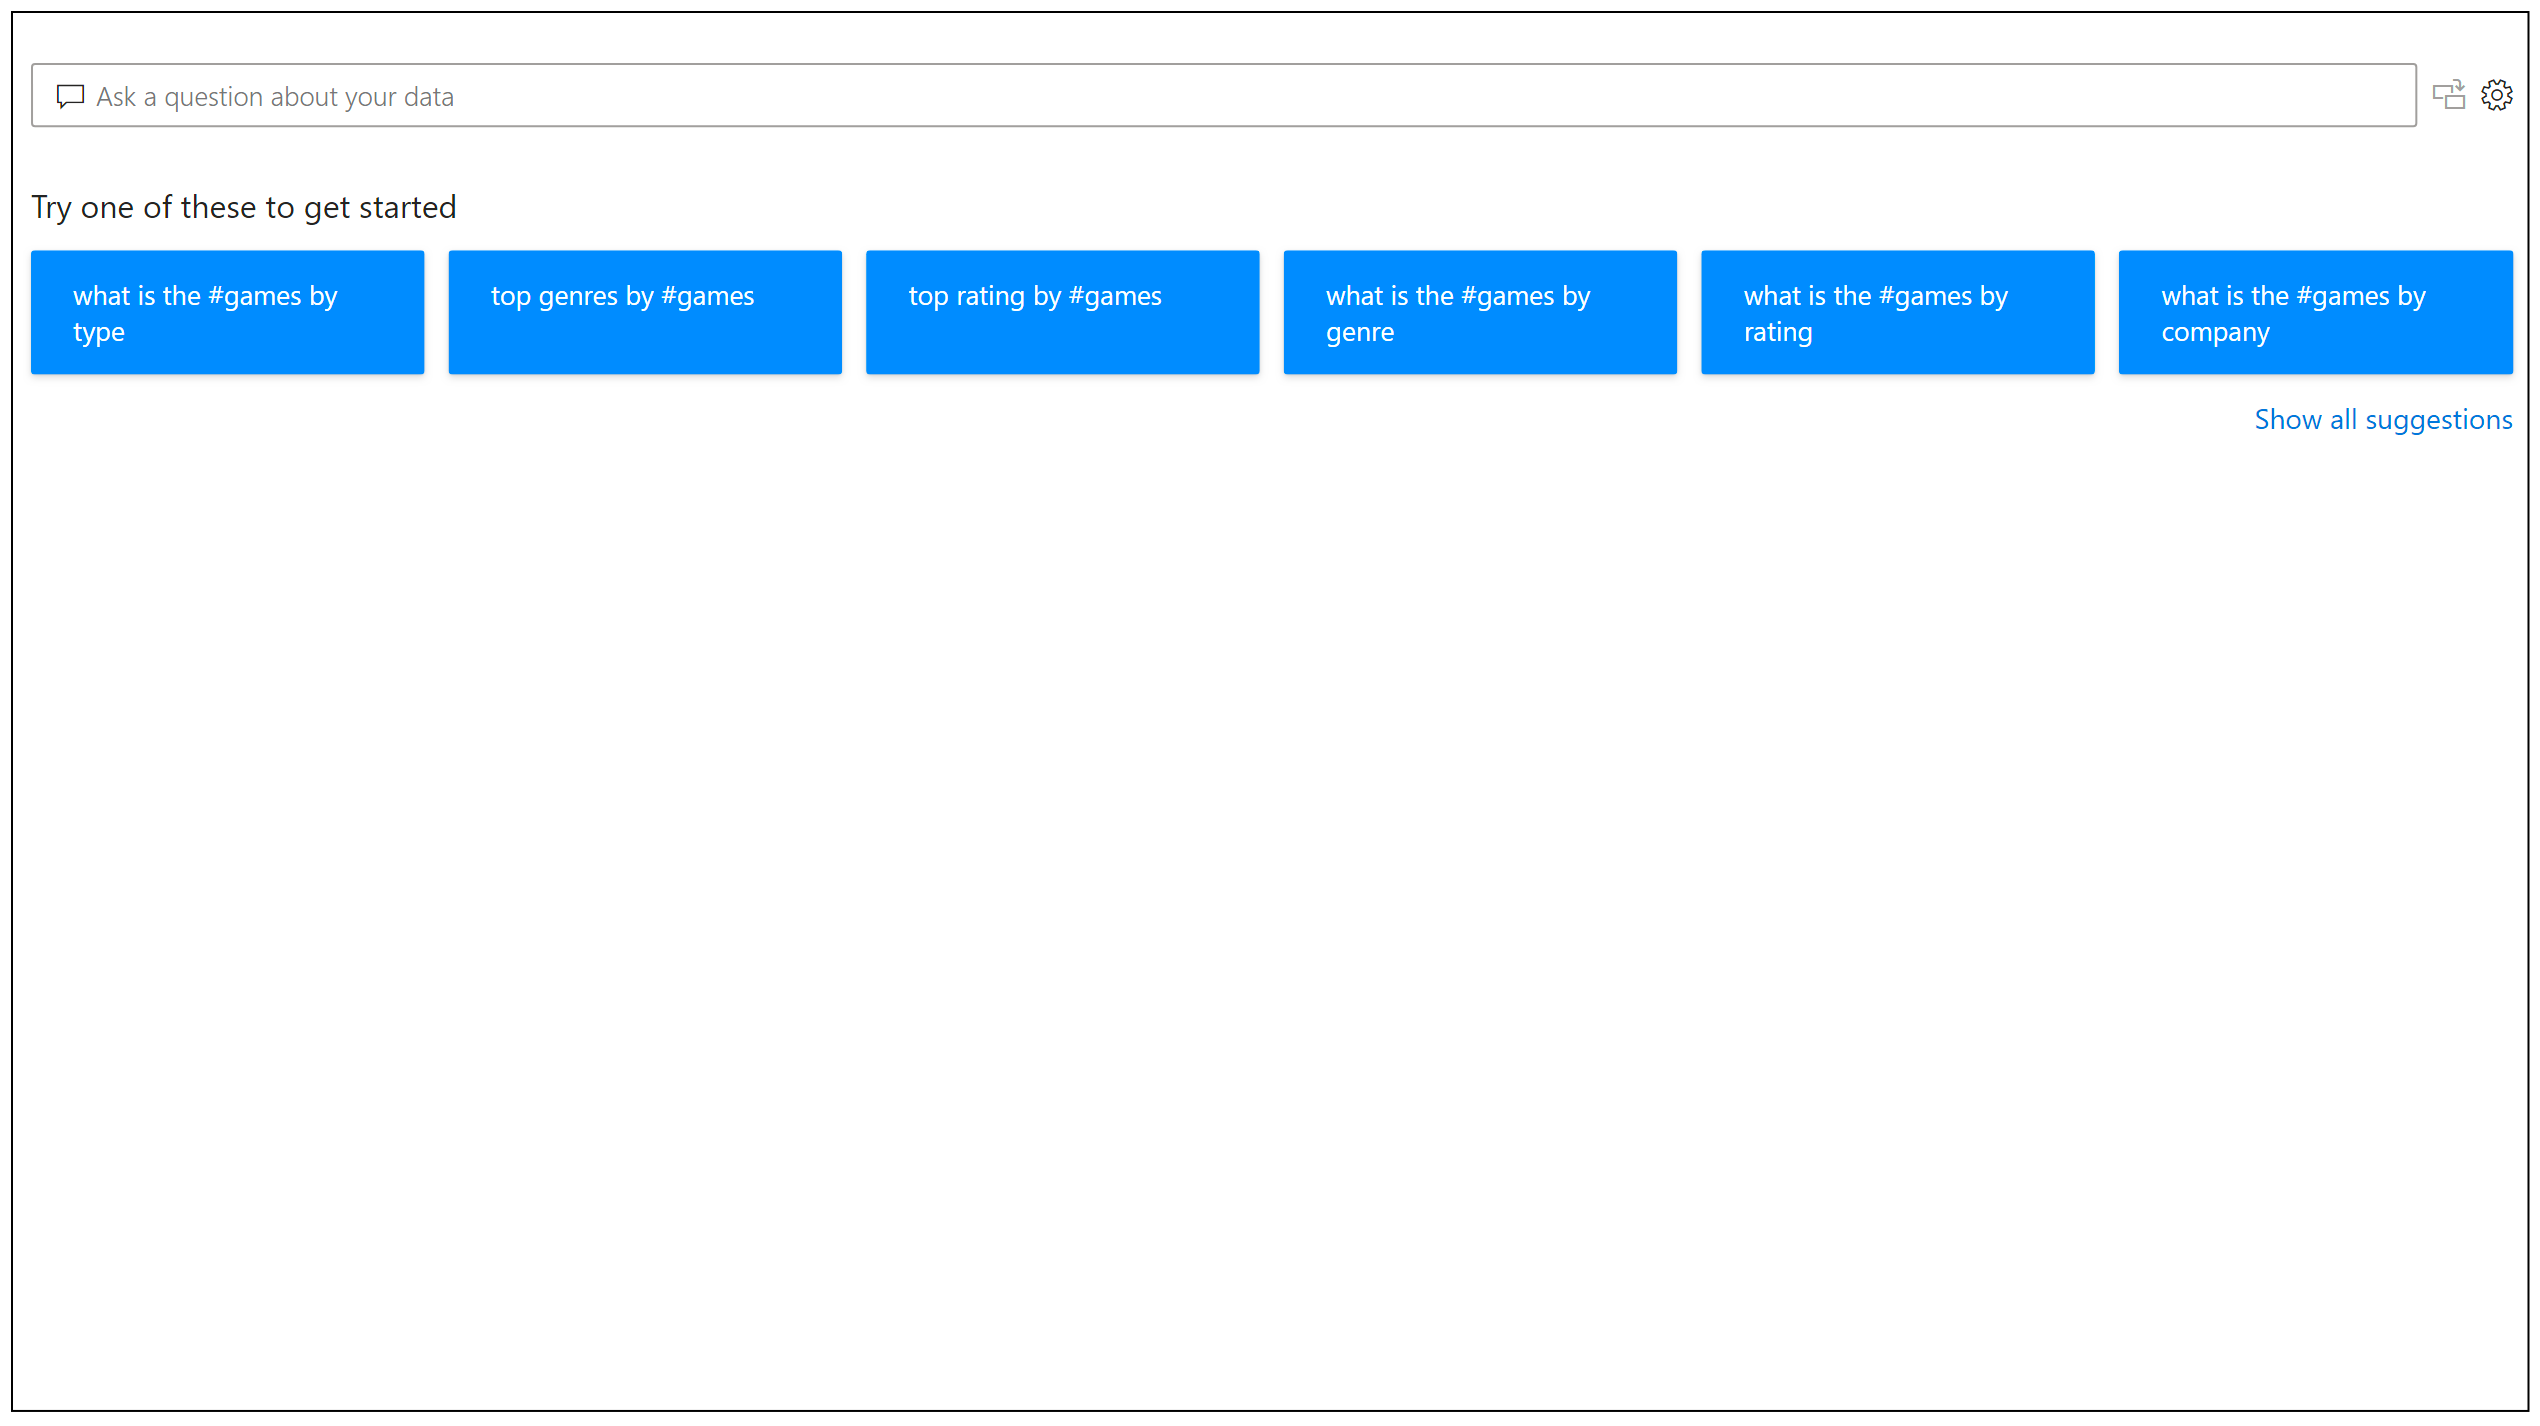
An AI natural language question & answering engine to create new report visual based on the answer to the question.
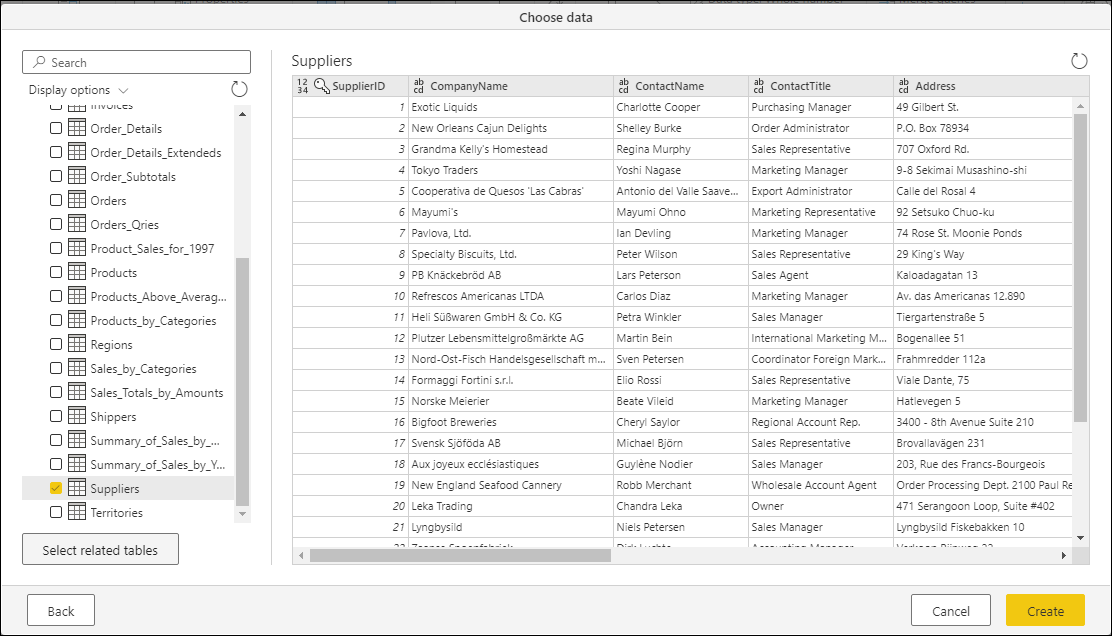
You can connect data into Power BI from hundreds of sources from files (Excel, SharePoint, XML), databases (SQL Server Database, Oracle Database, Amazon Redshift, Google BigQuery), Azure data connections, Power BI data sets and many online services (Dynamics 365, Salesforce Reports, Google Analytics and others).
5 Key AI Features of Power BI
- Azure Cognitive Services
Azure Cognitive Services are pre-trained machine learning models extract information from large pieces of data. They are directly integrated into Power BI to provide effective ways to extract information from multiple sources whether it be documents, images or social media sources.
Embedded algorithms can be used to break documents to identify information such as name of organization, people, and locations which can be used as insights to make well informed decisions.
Some of the key cognitive services that are available in Power BI are discussed below:
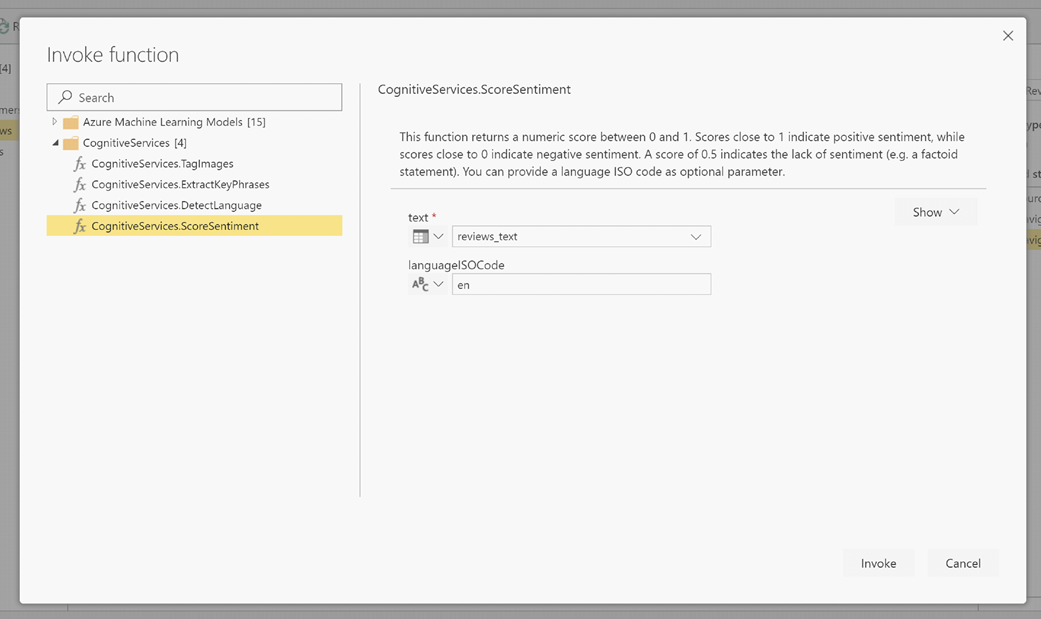
- Sentiment analysis
Sentiment analysis uses text analytics, text processing, part-of-speech analysis and other NLP technologies to help you evaluate and score sentiments, which you can further use in social media, discussion forms, and customer reviews.
The function uses machine learning to generate a sentiment score between 0 and 1 after you give it the text input. 1 denotes the maximum positive sentiment score and 0 denoting the lowest. This function supports various languages which includes English, French, German, and Spanish.
- Key phrase extraction
You can use this function to feed large amounts of unstructured text to the system and get a list of key phrases. Unlike sentiment analysis this function provides the better answer if you provide it with bigger blocks of text.
- Language detection
This function analyzes the text input, provides the ISO identifier and the language name. It can be utilized to evaluate data columns in which the language of the text in not known. About 120 languages are supported currently.
- image tagging
This function supports tagging of 2000+ recognizable objects, environmental settings, living species, and actions. Tagging doesn’t follow any inherited hierarchies or taxonomy. Tagging goes beyond the main subject in the image and covers the surrounding objects.
Note: The aforementioned services are included in Power BI Premium version and users don't need an Azure Cognitive Services subscription.
- Building Custom ML models using Azure Machine Learning
AutoML function automates the data science part required to create Machine Learning data models. The guardrails integrated within this function ensures the quality of these ML models and improve their visibility into the process which users use to build these models.
Power BI now allows business analysts to develop custom machine learning models without having to code with its AutoML function. Power BI uses automated machine learning features embedded in Azure Machine Learning to identify which models an analyst has permissions to and makes them accessible in an intuitive point and click user interface. With the help of this AI feature, collaborating with data scientists has become all the easier for the analysts.
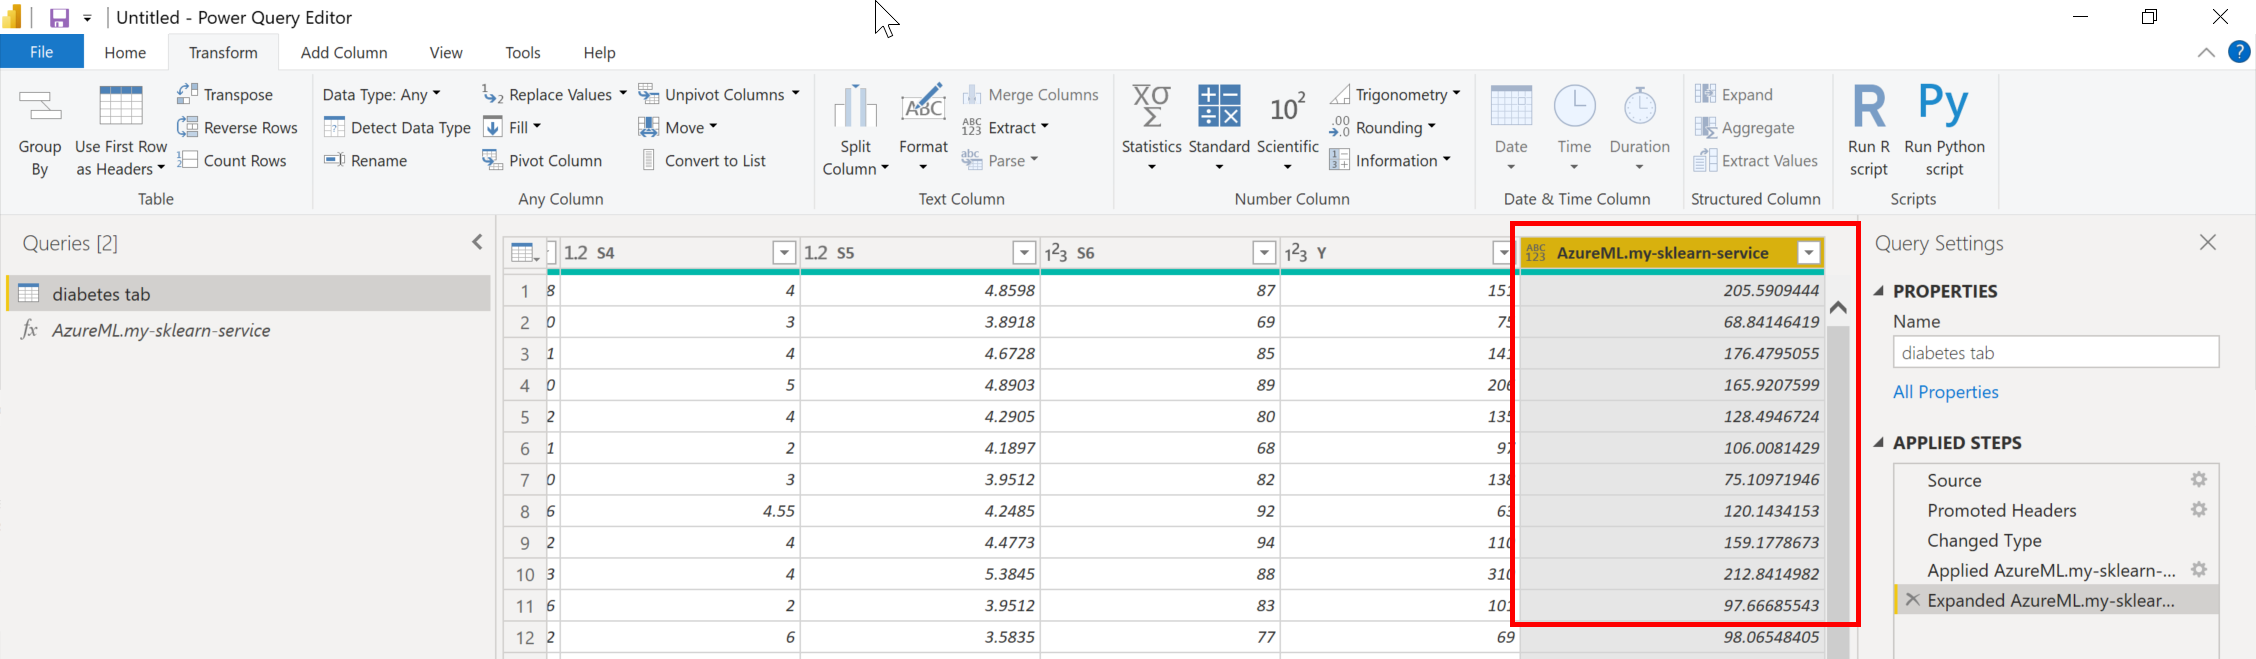
You can create supervised machine learning techniques such as Regression Models, Binary Prediction, and Classification for dataflows. Once a ML model is trained, a Power BI report showing the potential performance of your custom model is automatically generated. The report also gives an overview of the key factors that impacted the prediction given by your model.
- AI Builder
AI Builder is one of the new no-code Power BI features available in the Power BI platform that allows users to automate processes and predict outcomes. It is a solution that can be implemented into existing business processes and easily used during implementation. With AI Builder, users can now add intelligence to their applications without any coding or data science prerequisites. AI Builder is a useful feature for performing tasks such as model processing, object detection, text, and binary classification.
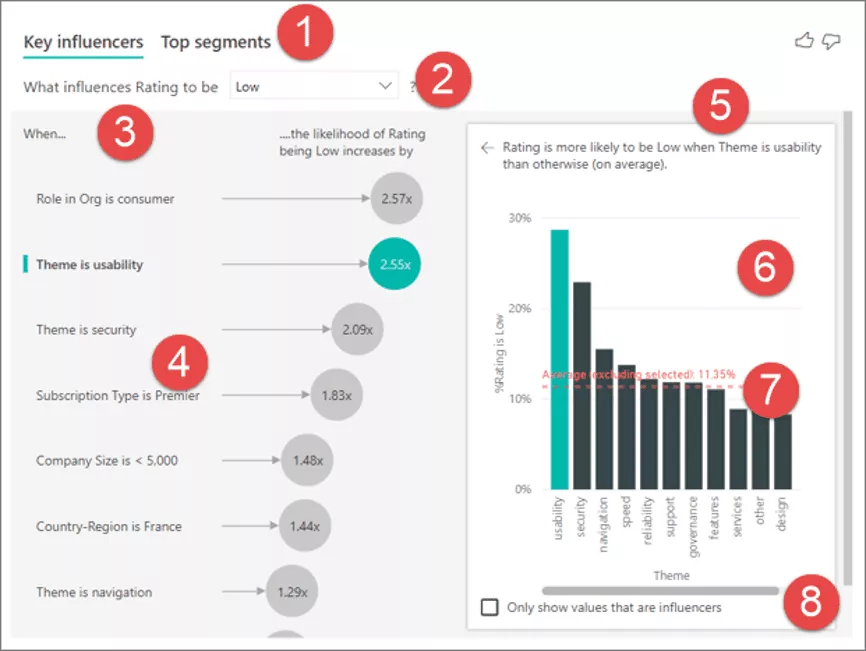
- Key Influencers Visual
Key Influencers Visual is new and one of the first AI-powered data visualization tools offered by Power BI. It analyzes data, categorizes key drivers, and displays key influencers to help users understand which factors are influencing the metric to be assessed.
With key influencers, users can now make the most of AI to gain insights from data as multiple concepts are combined into one. Here's an overview of the key influencer dashboard and the features it includes.
Source: https://docs.microsoft.com/en-us/power-bi/visuals/power-bi-visualization-influencers
- Tabs
The key influencers visual comes up with two tabs, firstly 'Key Influencers' which shows the contributors and secondly 'Top Segments' tab shows the segments which contributes to the selected value the most.
- Drop-Down box
This drop-down shows value of the metric that is being investigated.
- Restatement
This feature allows users to help understand what the visual is indicating. It is divided into two parts, one on the right pane and the other on the left pane.
- Left Pane
Left pane displays a list of top key influencers for a selected metric.
- Secondary restatement
Another area dedicated for restatement.
- Right Pane
Right pane consists of a graphic representation of the data.
- Average
This feature calculates the average values possible for the 'Theme' except for the influencer that is selected.
- Check-box
Checkbox acts like a filtering option that displays the values of the selected influencers.
- Power BI Chatbots
Chatbots is not a default feature of Power BI but, as a Microsoft Gold Partner, chatbots are integrated with Power BI to simplify data access & consumption. Power BI chatbots allows user to retrieve data and obtain analyze data from third-party messaging applications like Slack, Skype for Business and more, by simply asking questions in natural language and in turn the bot answers the question in the form of text or any other multimedia format.
This feature allows decision makers to obtain valuable business insights and metrics without much effort just by actively messaging application via chat. These chatbots are simplistic and easy to use which eliminates the hassle of filtering data manually and switching through multiple dashboards.


